METHODOLOGY
This study compares the performance of the two most popular open-source intrusion detection systems: Snort and Suricata, for their accuracy in harmful/malicious traffic detection in computer systems and networks, an assessment approach relying on the experimentation method. The study experiments will comprise a testbed that compares Suricata, Snort’s and Bro’s reaction; and entail inserting several traffic loads, occasioned by diverse transmission times, packet sizes, packet numbers, and bandwidths, followed by the analysis of each situation based on the processing conducted on the packets. Suricata, Snort, and Bro both use Emerging Threats detection rules latest to attain the comparable performance outcome.
EXPERIMENT SETUPS
Both Suricata and Snort solutions will be tested using three experiments as follows:
- Default OS and IDS configuration focus on only vital changes, such as selecting the accurate network interface.
| Suricata | Snort | Bro |
| Default-packet-size: 1514sid range: 100-999,999Maximum CPU load 12.5%Default memory limit 8MiBMaximum memory 512MiB | 1518 2200000-2299999. 60-100% 8MiB 512MiB | 1490 <100 40% 8MiB 512MiB |
- Replace or modify network socket packet capture modules to enhance capturing performance. This is achieved through:
- Increasing libpcap buffer sizes
- Optimize the IDS configurations
The tcpreplay software tests and regulates the various IDS setups at varying transmission speeds with undistinguishable pre-captured network traffics in Certified Associate in Python Programming certification (PCAP) formats. Tcpreplay is a collection of free Open Source utilities used to edit and rerunning formerly captured network traffic.
The experiments will be conducted based on the transmission speed defined by tcpreplay software. All the experimental tests are conducted no less than three times to identify and evade or correct any incongruities in the outcomes. As for the tcpreplay tool, the maximum transmission speed is specified using Mbps. The software matches the speeds during the experiment but cannot exceed the maximum. However, a similar investigation by [2] established that based on the network traffic features in the PCAP files, the actual speeds are often lower. Each of the test cycles’ defined average maximum rate is often roughly similar with the differences following under ± 5Mbpsas as discussed in [2].

- FAST HOMEWORK HELP
- HELP FROM TOP TUTORS
- ZERO PLAGIARISM
- NO AI USED
- SECURE PAYMENT SYSTEM
- PRIVACY GUARANTEED
After all the tests, the researcher will check and note the following:
- The definite average transmit speed
- Received packets number
- The volume of packets dropped by either the OS kernel or IDS.
- Memory usage
- CPU usage
The write operations and hard disk are also monitored. However, since the interest is mainly to write the created log information to the hard disk and not the entire capture network traffics, the researcher only confirmed that the HDD configuration could effectively manage such operation, and further examination of the HDD usage was unnecessary. The following section describes the outcomes or results of the three experiments 1, 2, and 3.
RESULTS
This section describes the test results for the three experiment setups. Several performance indicators such as memory usage, CPU usage, and dropped/analyzed packages were collected for every test cycle. However, for focus and accuracy, the details of each experiment will be adjusted accordingly.
Experiment 1: Default OS & IDS Configuration
For this experiment, Suricata and Snort IDSs are set up and compared with Bro based on the essentials in the installation manuals for Suricata [1], Snort [3], and Bro [4]. Figure 1 shows Dropped packets based on default settings for Suricata, Snort, and Bro.
Figure 1: Percentage of packets dropped with IDS configuration
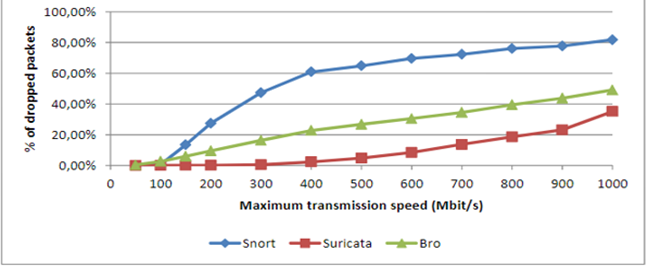
The figure shows all the three commonly used IDS in their default configurations. The IDS can manage bandwidths of up to 100Mbps with minimal or no dropped packets. The results change drastically with higher speeds, with Snort dropping at the highest rate, followed by Bro, while Suricata attains the best outcomes. The higher rates of dropping packets in both Bro and Snort are attributed to their single-threaded feature, which is likely to make them overwhelmed by traffic. This is distinctly indicated in figure 2 on CPU utilization. The study uses a Hyper-Threading enabled quad-core CPU, with eight logical processors available for the OS, meaning that 12.5% of the CPU is utilized when one of the eight logical processors is entirely used up.
Figure 2: CPU Utilization for Suricata, Snort, and Bro
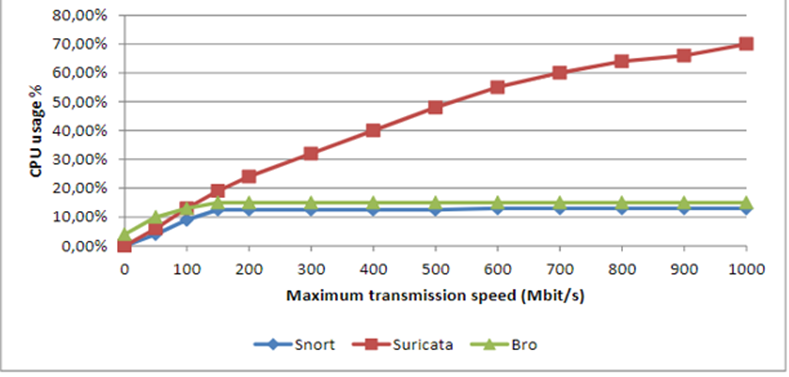
Figure 2 shows the percentage of CPU used by Suricata, Snort, and Bro in their default configuration.
The single-threaded Snort can only use one processor. Besides, the CPU load generated by Snort does not surpass 12.5% or use more than one logical processor even with an increase in transmission speed. Even though Bro is also a single-threaded engine like Snort, studies have shown that it has a manager and communication protocol operating as a separate process; hence it uses additional logical processor space than Snort. The communication loop alone creates an extra load that takes up about 4% of the CPU space used on the system even without any traffic being analyzed [2]. From figure 2, Suricata uses more processing power than both Snort and Bro. The CPU usage rises linearly, but with an indication of some room for improvements because Suricata is also dropping some packets, which means that the CPU is not fully utilized.
Experiment 2: Optimization of the IDS configurations
Experiment 1 demonstrated that the default configuration for the three IDSs is not ideal for high-speed traffic network analysis that exceeds 100Mbit/s. Hence, experiment 2 tests whether altering IDS configuration can attain better outcomes. The Snort and Suricata IDS configuration alteration is a consequent consulting user manuals and best-practice guides.
Snort Configuration
As for Snort, the first change was to adjust the default memory limit from 8MiB to 512MiB to prevent the warming message for memory cap exceeded. The number of concurrent sessions to track was set to 1048575, which is the maximum Snort can support. As for the detection engine pattern matcher algorithm (DEPMA), the Snort user manual indicates that Snort IDS uses an ac-split (Aho-Corasick Full) algorithm search system. According to the Snort manual, the systems offer high performance with lower memory utilization; hence an excellent compromise between IDS performance and memory [3]. Besides, the ac-split (Aho-Corasick Full) algorithm also indicated a good performance with 15% reduced dropped packets but will require additional memory for all search methods. As for this experiment, the additional researcher 1.4GiB to the ac-split process was not a problem since the test host had a total memory of 70GiB.
As for HTTP traffic, Snort default configuration had no limit set for HTTP traffic analysis, which in turn heavily loaded the CPU for higher volumes of HTTP transfers, for both server flow and client flow depths.
- server_flow_depth 0 \
- client_flow_depth 0 \
Snort user manual indicate that Snort’s default values for client flow and server flow depths are 300bytes. This implies that Snort IDS can only inspect the first 300bytes server response and client quest packet. However, as for experiment 2, the aim was to ensure optimal intrusion detection without a mission, even a single potential threat. The client flow depth was increased to 1460, the maximum for snort. The Snort rules only examine HTTP packet headers; hence, the researcher believes this limit is practical for most scenarios. The outcomes were impressive as it generated 25% fewer dropped packets.
Suricata
Similar to Snort, Suricata’s default memory was adjusted from 32MiB to 512MiB to ensure no session was pruned because of low memory issues during the test cycles. The researcher noted no further improvement by increasing the memory above 512MiB. As for packet processing, the Suricata user manual indicates that the IDS can only process 1024 packets simultaneously [1]. However, the researcher did not significantly improve performance by adjusting the limit to 4096, the maximum for Suricata. However, adjusting the limit adversely impacted caching. Hence, this configuration has a thin line between enhancing and deteriorating performance.
As for detection engine configuration, Suricata uses a multi-pattern matcher (MPM), ac (Aho-Corasick) algorithm but has a single distribution context offering higher performance with low memory usage. The dropped packet decreased significantly (by twofold) when the distribution context was adjusted to full. However, this required a higher memory of above 30GiB and a longer time to the set rules. Since other detection algorisms such as the b2gc algorithm provide the same performance with less memory utilization, the researcher considered it rational to go for alternatives. The b2gc algorithm-generated optimal results for our case. mpm_algo: b2gc. However, the detection engine profile was set higher than the default average, which generated higher performance. Table 1 indicates the percentage of dropped packages following optimization for both Snort and Suricata, while figure 3is a graphical representation of the results.
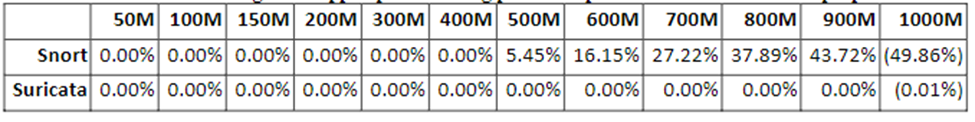
Table 1: Dropped Packets for Suricata and Snort after Optimizations
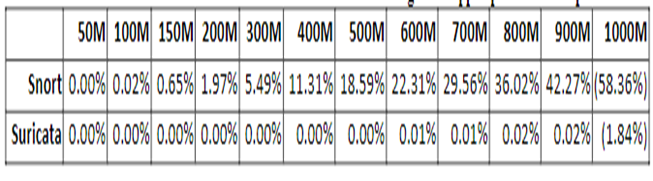
Figure 3: Graph of Dropped Packets for Suricata and Snort after Optimizations
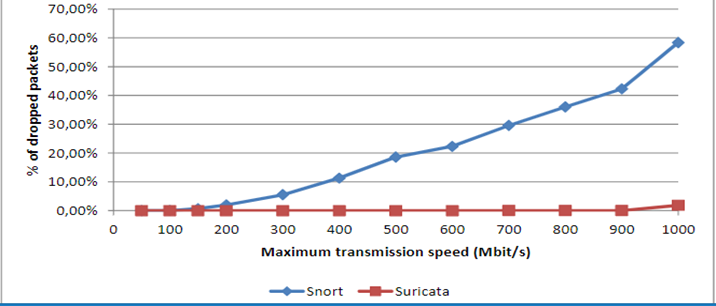
Table 1 represents the percentage of dropped packets following the optimization on both Snort and Suricata. The two IDSs exhibited a significant improvement in reducing the volumes of dropped packets. However, Suricata almost attained a no dropped packet after optimization, indicating a significant improvement, while Snort still demonstrated the need for further improvement to reach the reduction in dropped packets, the level of Suricata. Figure 3 is a graphical representation of table 1.
Figure 4: Graph of CPU Utilization for Suricata and Snort after Optimizations
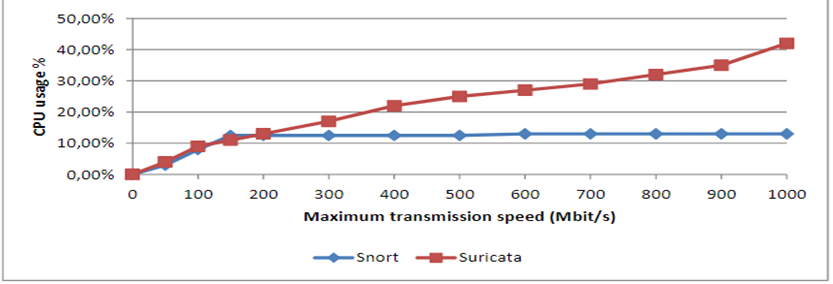
Figure 4 shows the CPU utilization for both Suricata and Snort after optimization. Snort’s CPU usage remained constant because only one processor was used. However, Suricata exhibited 30% lower CPU usage after optimization. The researcher applied the CPU affinity to limit Suricata to using only four processors; otherwise, the values could have been higher. The reason to limit Suricata to use only four processors was to evade Hyper-Threading.
Experiment 3: Increasing Libpcap Buffer Sizes
The third experiment involves modifying network socket capture modules to boost capture performance. In this case, the researcher opted for increasing libpcap buffer sizes. The libpcap has a default buffer size of 32KiB. This is advantageous for a range of moveable solutions. Nevertheless, the buffer size for this experiment is adjusted to a higher value. Linux has a maximum buffer size of 2GiB. However, there is plenty of free memory in the tcpreplay system used in this experiment; hence memory is not a problem.
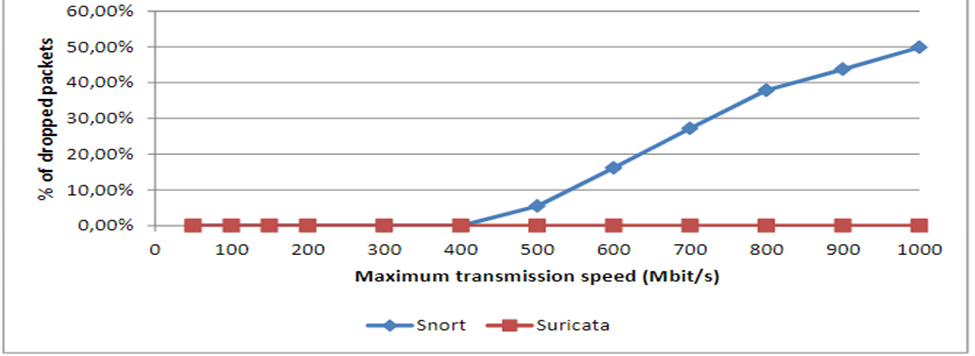
The configuration achieved between 5% and 15% fewer dropped packets for Snort than in the previous experiments. However, the outcomes were not very stable, and the researcher had to repeat the experiments numerous times to verify accuracy and attain an average long-lasting result. However, Snort managed to analyze 420Mbit/s traffic minus any dropped packet, which indicates an excellent improvement. As for Suricata, the configuration in experiments 1 and 2 managed to achieve zero dropped packets, shown in Table 1 and Figure 5.
Table 2: Dropped Packets using 2GiB Libpcap Buffer Size and Previous Configuration
Figure 5: Graph of Dropped Packets using 2GiB Libpcap Buffer Size and Previous Configuration
The CPU load remained the same as in experiment 2 as the researcher did not alter much of the Suricata and Snort processes.